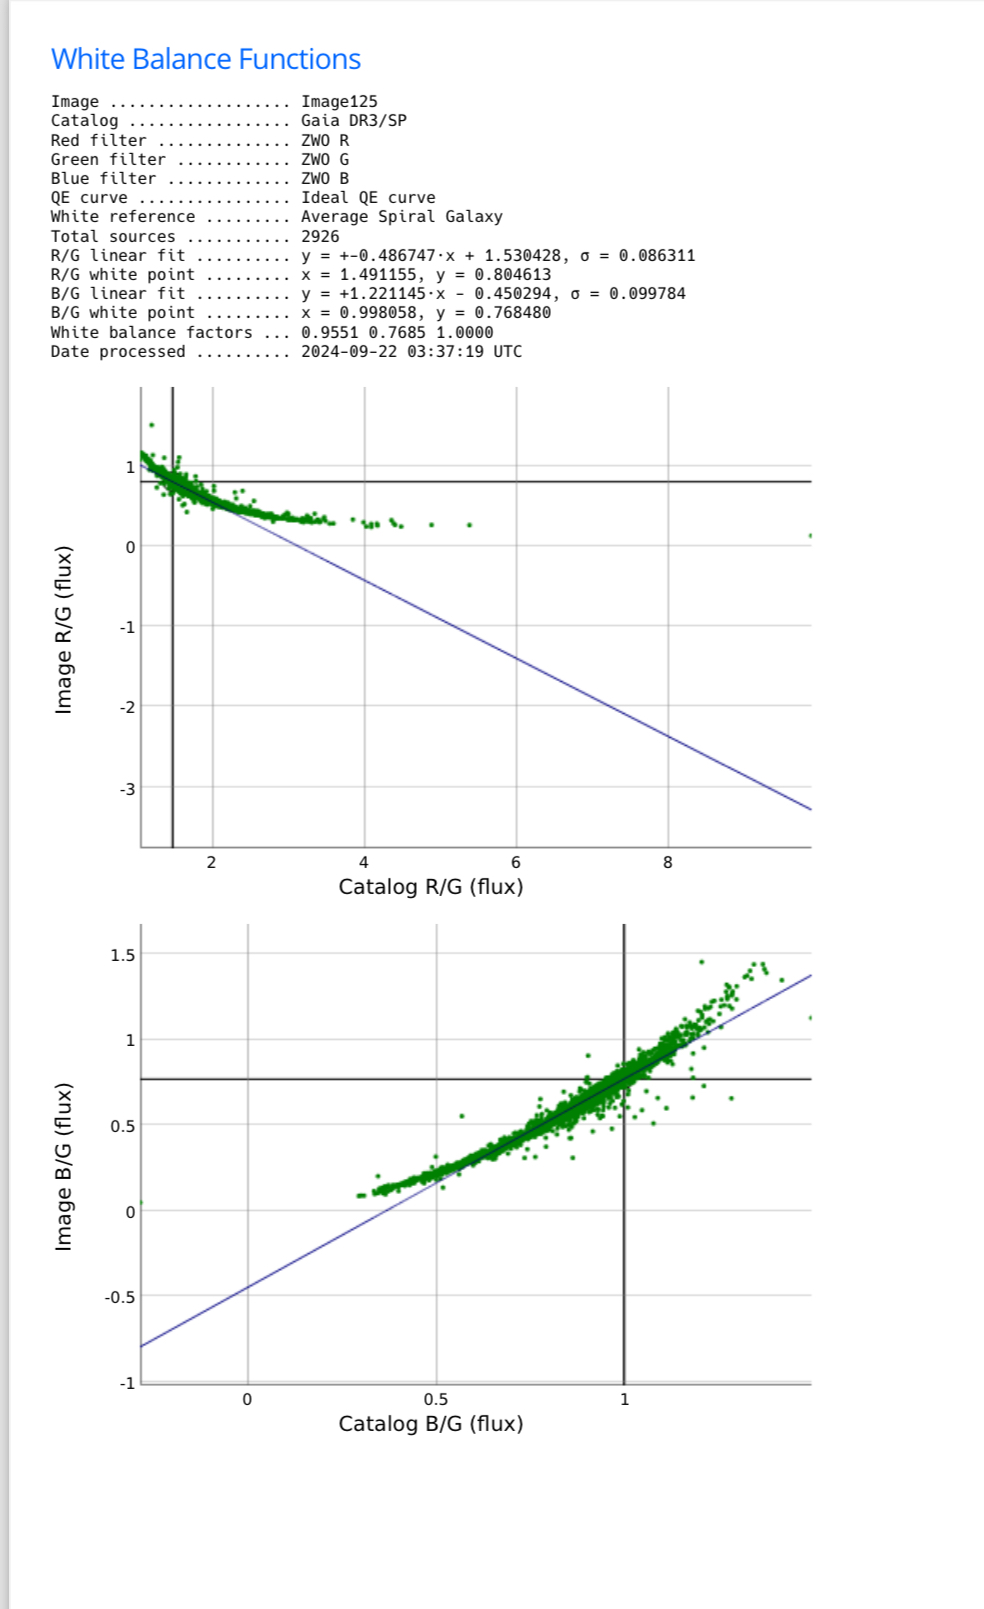
Try to exchange B and G channel.
Your second graph shows a clear 1/x behavior, which indicates that you might have assigned B to G and vice versa.
|
You cannot like this item. Reason: "ANONYMOUS".
You cannot remove your like from this item.
Editing a post is only allowed within 24 hours after creating it.
You cannot Like this post because the topic is closed.
Copy the URL below to share a direct link to this post.
This post cannot be edited using the classic forums editor.
To edit this post, please enable the "New forums experience" in your settings.
Yes; this is great feedback, thanks!
I’m praying it really is something as simple as accidentally switching my filters around.
And if so, I will be having my spouse checking me yearly for early on-set Alzheimer’s.
Sucks for him, I guess, if that IS actually the problem / solution. Hahah
Itching to get back to my computer tonight to troubleshoot.
|
You cannot like this item. Reason: "ANONYMOUS".
You cannot remove your like from this item.
Editing a post is only allowed within 24 hours after creating it.
You cannot Like this post because the topic is closed.
Copy the URL below to share a direct link to this post.
This post cannot be edited using the classic forums editor.
To edit this post, please enable the "New forums experience" in your settings.
Paul Huntley:
*I have mineset just the way you have them set in your screenshot. I'musing a 571 one shot color sensor.
Ron Abbott ** Type your reply here ***
If you mean your camera is using a Sony IMX571 color sensor, then select this for QE Curve:
 I thought that for OSCs you always chose the "ideal QE curve" as the quantum efficiency of the sensor is built directly into the R, G, B color response curves?
|
You cannot like this item. Reason: "ANONYMOUS".
You cannot remove your like from this item.
Editing a post is only allowed within 24 hours after creating it.
You cannot Like this post because the topic is closed.
Copy the URL below to share a direct link to this post.
This post cannot be edited using the classic forums editor.
To edit this post, please enable the "New forums experience" in your settings.
Tom Boyd:
Paul Huntley:
*I have mineset just the way you have them set in your screenshot. I'musing a 571 one shot color sensor.
Ron Abbott ** Type your reply here ***
If you mean your camera is using a Sony IMX571 color sensor, then select this for QE Curve:
I thought that for OSCs you always chose the "ideal QE curve" as the quantum efficiency of the sensor is built directly into the R, G, B color response curves? I have no experience with OSC. I think your reasoning could be right. I use this setting as a pipeline setting for all occasions.
|
You cannot like this item. Reason: "ANONYMOUS".
You cannot remove your like from this item.
Editing a post is only allowed within 24 hours after creating it.
You cannot Like this post because the topic is closed.
Copy the URL below to share a direct link to this post.
This post cannot be edited using the classic forums editor.
To edit this post, please enable the "New forums experience" in your settings.
Think of the Quantum Efficiency (QE) as a response curve for a particular sensor. If your sensor is NOT listed in the dropdown, use Ideal QE Curve as it is a good overall approximation for unlisted sensors. Otherwise, if your sensor is listed, the measured QE curve for your sensor is embedded into the selection I posted earlier.
Narrowband settings are bit different, you select the filters (many popular filters are in the dropdown) and then also enter the wavelength of that emission line.
|
You cannot like this item. Reason: "ANONYMOUS".
You cannot remove your like from this item.
Editing a post is only allowed within 24 hours after creating it.
You cannot Like this post because the topic is closed.
Copy the URL below to share a direct link to this post.
This post cannot be edited using the classic forums editor.
To edit this post, please enable the "New forums experience" in your settings.
Mike Cranfield:
It looks to me like you may have got your filters mixed up. If you are using a filter wheel double check the filters are in the right slots. If you are changing filters manually check you have the right filter in the right box! Your second graph is basically saying that as blue gets stronger relative to green in the actual star your image has blue getting weaker relative to green. The non linear shape is odd - have you used one of your NB filters by mistake? I would tend to agree that the filters are not identified correctly. Is this the first time you have used this camera/filter setup? If it is, do not look at your filters, look through your filters to identify them correctly. Reflections look different that the light that is filtered. Best of luck Chris
|
You cannot like this item. Reason: "ANONYMOUS".
You cannot remove your like from this item.
Editing a post is only allowed within 24 hours after creating it.
You cannot Like this post because the topic is closed.
Copy the URL below to share a direct link to this post.
This post cannot be edited using the classic forums editor.
To edit this post, please enable the "New forums experience" in your settings.
Paul Huntley:
Think of the Quantum Efficiency (QE) as a response curve for a particular sensor. If your sensor is NOT listed in the dropdown, use Ideal QE Curve as it is a good overall approximation for unlisted sensors. Otherwise, if your sensor is listed, the measured QE curve for your sensor is embedded into the selection I posted earlier.
Narrowband settings are bit different, you select the filters (many popular filters are in the dropdown) and then also enter the wavelength of that emission line. This is what I thought. Does not work this way. Selection of specific sensors produced often distorted colors. Not disaster. But not ideal either.
|
You cannot like this item. Reason: "ANONYMOUS".
You cannot remove your like from this item.
Editing a post is only allowed within 24 hours after creating it.
You cannot Like this post because the topic is closed.
Copy the URL below to share a direct link to this post.
This post cannot be edited using the classic forums editor.
To edit this post, please enable the "New forums experience" in your settings.
Cfreerksen:
Mike Cranfield:
It looks to me like you may have got your filters mixed up. If you are using a filter wheel double check the filters are in the right slots. If you are changing filters manually check you have the right filter in the right box! Your second graph is basically saying that as blue gets stronger relative to green in the actual star your image has blue getting weaker relative to green. The non linear shape is odd - have you used one of your NB filters by mistake?
I would tend to agree that the filters are not identified correctly. Is this the first time you have used this camera/filter setup? If it is, do not look at your filters, look through your filters to identify them correctly. Reflections look different that the light that is filtered.
Best of luck
Chris Yes, it was the first time I was using new LRGB filters. Sadly, as noted above, I already took them out of the filter wheel and moved them from a 5 wheel to 7 wheel setup. I’ll double check tonight if for some reason, I have the B and G confused in the new wheel, but I’ll never be able to go back and check my setup for this shoot with absolute certainty as to what I had where in my 5 wheel setup because I’ve already switched wheels. What’s odd to me is that the R to G chart looks great. It’s just the B to G chart that doesn’t. I’d be shocked if I confused my B filter for Ha, but stranger things have happened. Will inspect tonight the wheel itself and the files on my computer and let you know what I find. Thanks so much for replying!
|
You cannot like this item. Reason: "ANONYMOUS".
You cannot remove your like from this item.
Editing a post is only allowed within 24 hours after creating it.
You cannot Like this post because the topic is closed.
Copy the URL below to share a direct link to this post.
This post cannot be edited using the classic forums editor.
To edit this post, please enable the "New forums experience" in your settings.
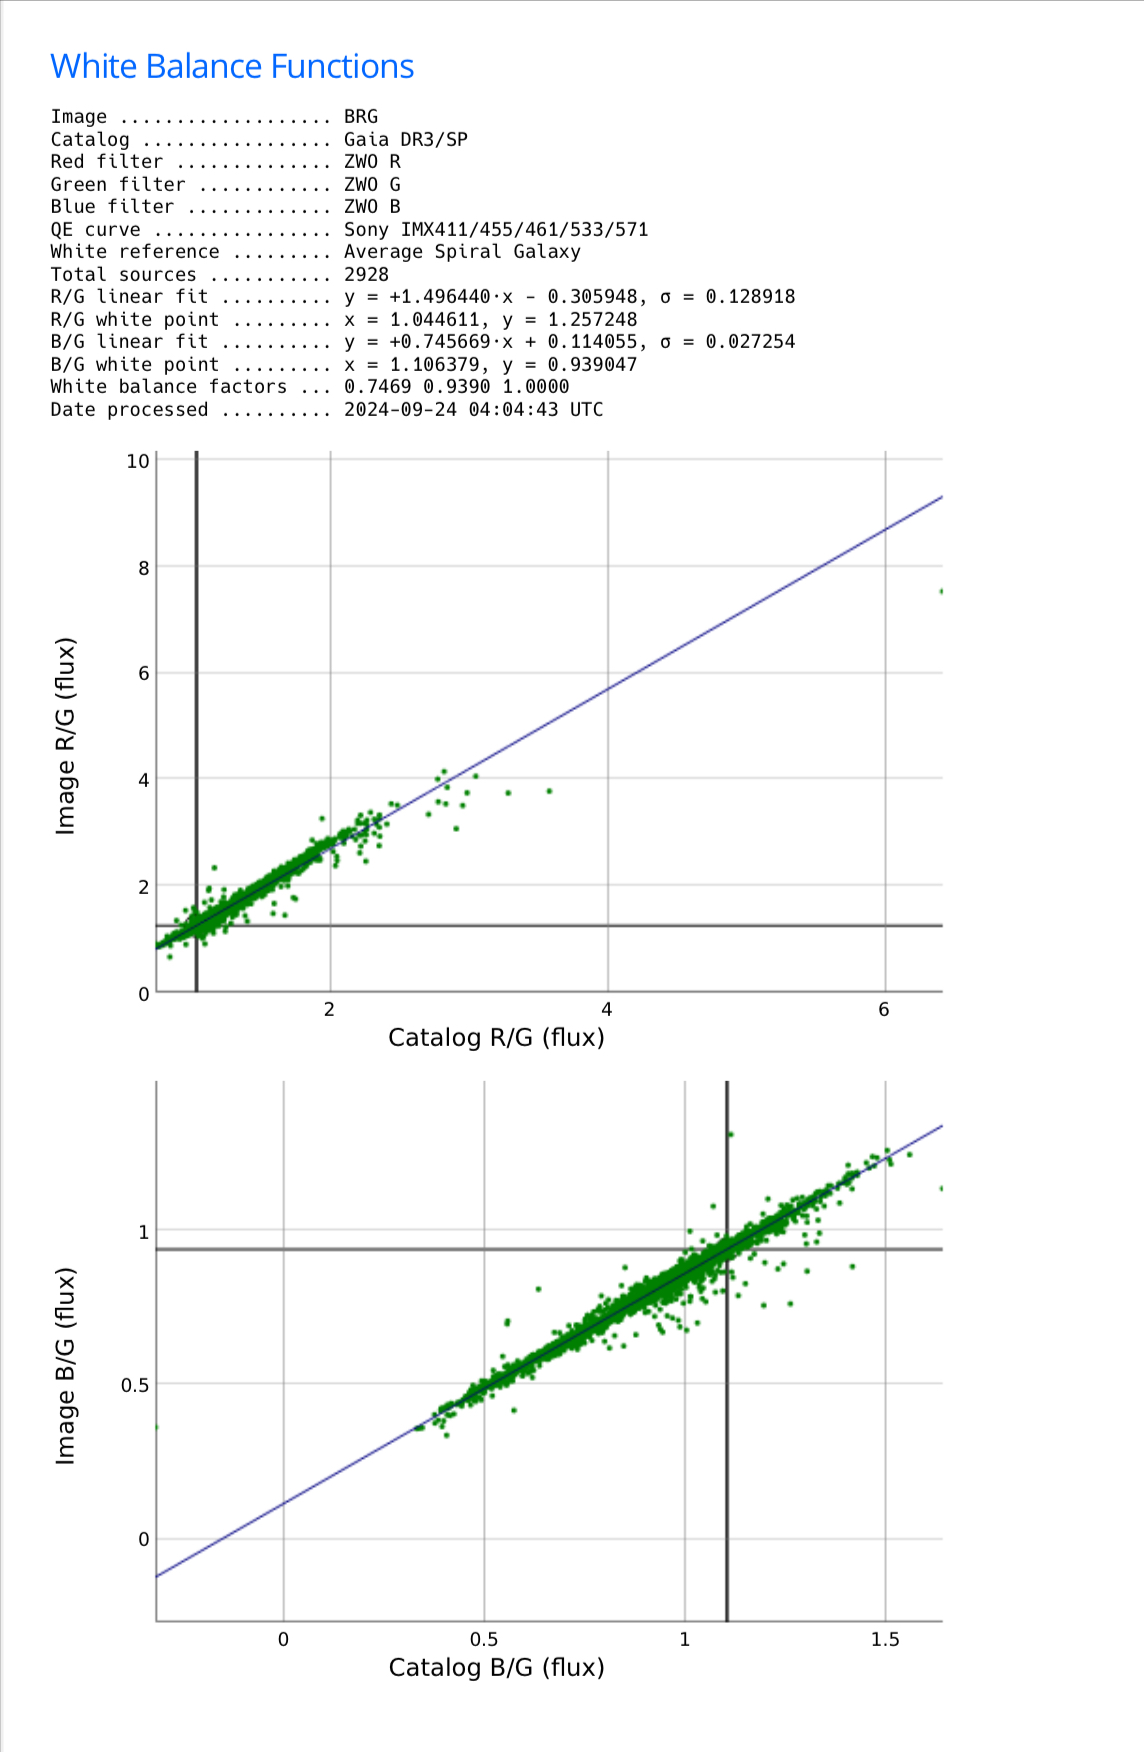
Ok, after some great feedback, I can confirm the following: 1. I did not accidentally switch my blue filter for an Ha filter. I know this because the next night, before I replaced the filter wheel entirely, I shot one night of Ha data, and my flats were auto calculated by ASIair to last 15 seconds long, whereas my blue flats from the night before were about 8 seconds. 8 vs 15 sounds correct. So, no accidental switching, there. 2. Second, I tried switching in SPCC from my specific Sony sensor to the Ideal QE curve setting. That didn’t make a difference whatsoever. My blue to green graph in the SPCC results was still just as wonky. 3. I re-ran WBPP and started from scratch. My master lights for each filter all looked same as before. So no pre-processing issues I could identify. 5. So, I tried integrating an RGB image swapping out my blue data for green data and vice versa and then running gradient correction and SPCC again. Voila —— WAY, WAY better visual results. The SPCC results via graph, however, still aren’t perfect: 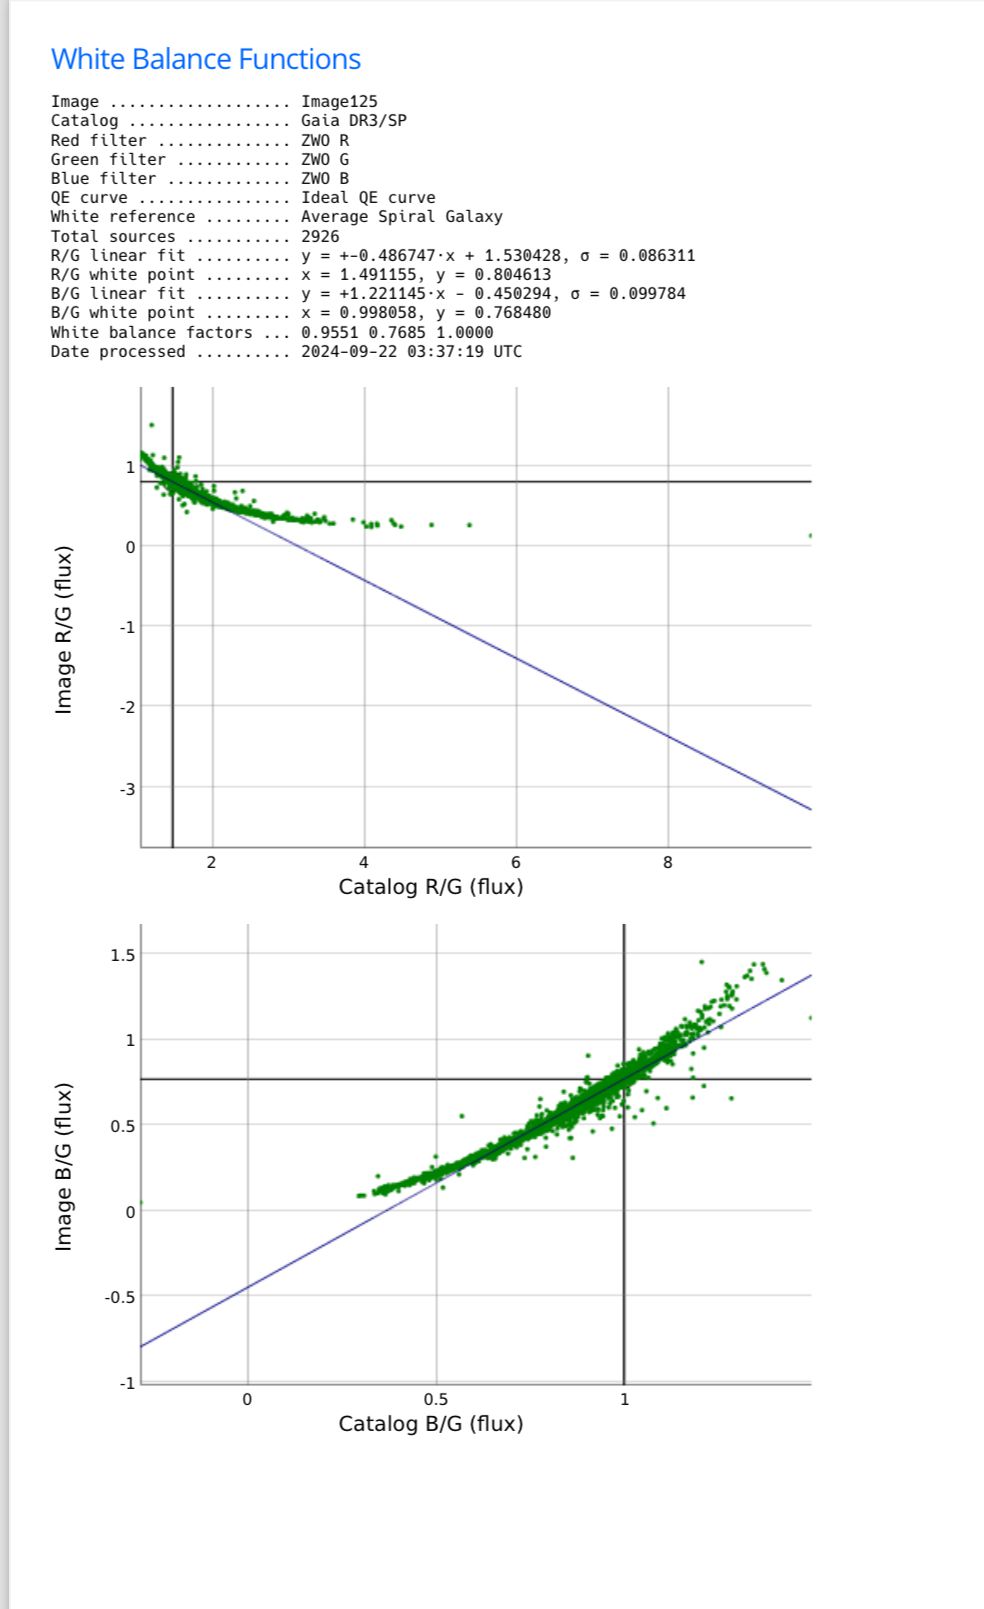 But I do think I’m on a better track now. The purple/magenta issues I was having went away, and color adjusting after SPCC with SCNR was much easier. So my follow-up question is this: Do I need to be worried about these less than perfect SPCC graph results? They still don’t follow that perfectly linear regression the way I see them do so in tutorials. Will that cause problems down the road as I further post-process the image?
|
You cannot like this item. Reason: "ANONYMOUS".
You cannot remove your like from this item.
Editing a post is only allowed within 24 hours after creating it.
You cannot Like this post because the topic is closed.
Copy the URL below to share a direct link to this post.
This post cannot be edited using the classic forums editor.
To edit this post, please enable the "New forums experience" in your settings.
But now the R/G graph is wrong. This one shows now the 1/x behavior. I would try all permutations of RGB and I am pretty sure that you will find the one which gives 2 linear plots with positive slope.
|
You cannot like this item. Reason: "ANONYMOUS".
You cannot remove your like from this item.
Editing a post is only allowed within 24 hours after creating it.
You cannot Like this post because the topic is closed.
Copy the URL below to share a direct link to this post.
This post cannot be edited using the classic forums editor.
To edit this post, please enable the "New forums experience" in your settings.
Ok, after some great feedback, I can confirm the following:
1. I did not accidentally switch my blue filter for an Ha filter. I know this because the next night, before I replaced the filter wheel entirely, I shot one night of Ha data, and my flats were auto calculated by ASIair to last 15 seconds long, whereas my blue flats from the night before were about 8 seconds. 8 vs 15 sounds correct. So, no accidental switching, there.
2. Second, I tried switching in SPCC from my specific Sony sensor to the Ideal QE curve setting. That didn’t make a difference whatsoever. My blue to green graph in the SPCC results was still just as wonky.
3. I re-ran WBPP and started from scratch. My master lights for each filter all looked same as before. So no pre-processing issues I could identify.
5. So, I tried integrating an RGB image swapping out my blue data for green data and vice versa and then running gradient correction and SPCC again.
Voila —— WAY, WAY better visual results.
The SPCC results via graph, however, still aren’t perfect:
But I do think I’m on a better track now.
The purple/magenta issues I was having went away, and color adjusting after SPCC with SCNR was much easier.
So my follow-up question is this:
Do I need to be worried about these less than perfect SPCC graph results? They still don’t follow that perfectly linear regression the way I see them do so in tutorials. Will that cause problems down the road as I further post-process the image? Maybe filters inherently incorrect; that is manufacturer made mistakes in labeling them.
|
You cannot like this item. Reason: "ANONYMOUS".
You cannot remove your like from this item.
Editing a post is only allowed within 24 hours after creating it.
You cannot Like this post because the topic is closed.
Copy the URL below to share a direct link to this post.
This post cannot be edited using the classic forums editor.
To edit this post, please enable the "New forums experience" in your settings.
I would take another data set, one where you are careful with filters and lebelling - on both your flats and your frames. If you get better, more linear results then you have solved the problem and it was a consequence of mixing up the frames (and possibly the flats), with the filter. If you get the same results, then (and only then) could you conclude it is an issue with your filters.
Hope this helps,
Dave
|
You cannot like this item. Reason: "ANONYMOUS".
You cannot remove your like from this item.
Editing a post is only allowed within 24 hours after creating it.
You cannot Like this post because the topic is closed.
Copy the URL below to share a direct link to this post.
This post cannot be edited using the classic forums editor.
To edit this post, please enable the "New forums experience" in your settings.
I suggest asking on the PixInsight forums. Someone may recognize this symptom on the graph. You might get a reply from the person who wrote or maintains SPCC.
For what it's worth, I went through several of my older RGB files, including OSC and R/G/B and different filters, and I never get a negative slope on a graph. If I'm understanding it, a negative slope implies an inverse relationship between the image star colors and the catalog star colors; stars that are more red in the catalog are less red in the image. I also tried intentionally swapping G and B channels and got a negative slope on the B/G graph, but there must be other possible causes.
|
You cannot like this item. Reason: "ANONYMOUS".
You cannot remove your like from this item.
Editing a post is only allowed within 24 hours after creating it.
You cannot Like this post because the topic is closed.
Copy the URL below to share a direct link to this post.
This post cannot be edited using the classic forums editor.
To edit this post, please enable the "New forums experience" in your settings.
Christoph Nieswand:
But now the R/G graph is wrong. This one shows now the 1/x behavior. I would try all permutations of RGB and I am pretty sure that you will find the one which gives 2 linear plots with positive slope. I agree with Christoph. The graph is not a positive slope and this is in my opinion a dead giveaway that there is still an issue. I loaded my filter wheel a long while ago and did not look through the filters to identify. I had all mine skewed. Instead of RGB I had GBR, each offset by one. here is a typical graph found in the Pixinsight manual. Do yourself a favor and check your filters and either move them or make note on the filter wheel the order loaded. Chris 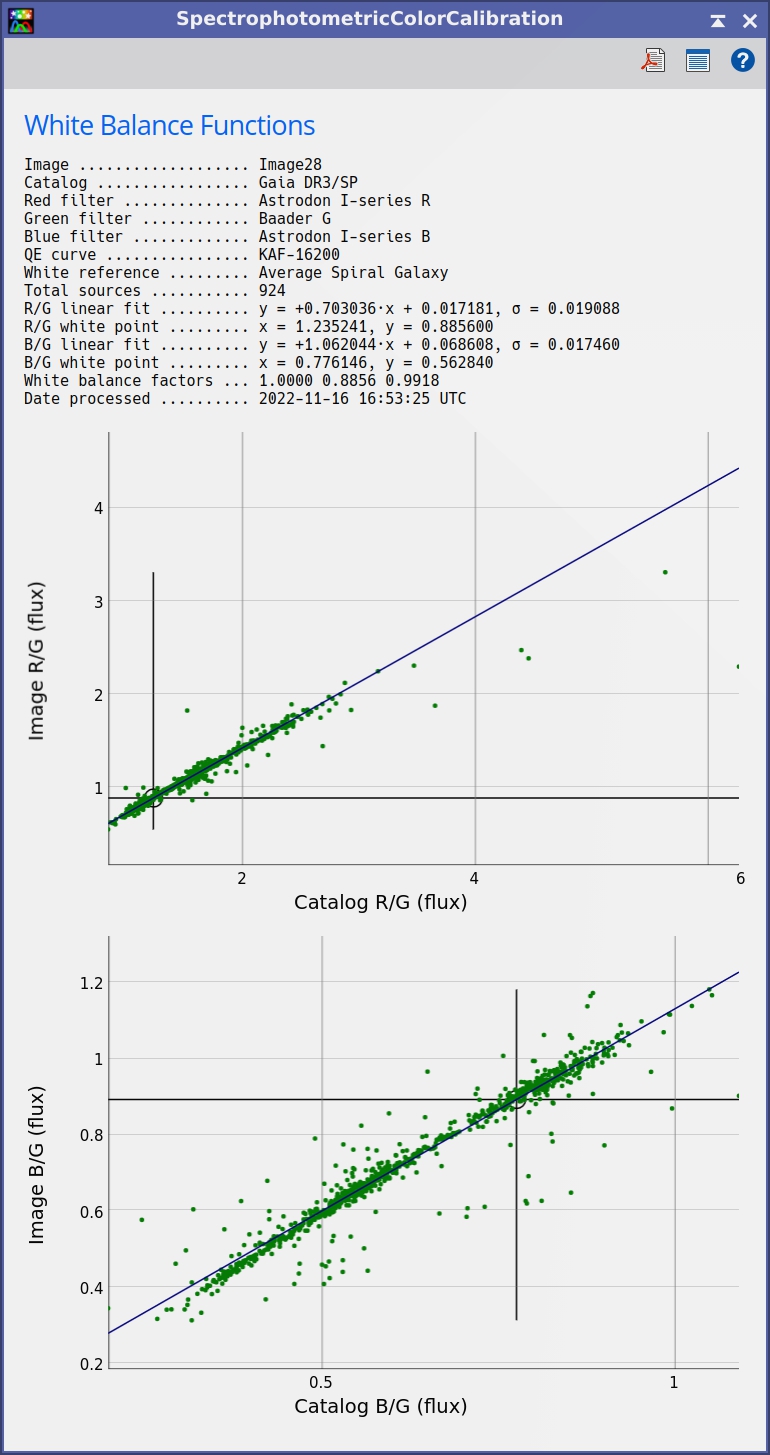 |
You cannot like this item. Reason: "ANONYMOUS".
You cannot remove your like from this item.
Editing a post is only allowed within 24 hours after creating it.
You cannot Like this post because the topic is closed.
Copy the URL below to share a direct link to this post.
This post cannot be edited using the classic forums editor.
To edit this post, please enable the "New forums experience" in your settings.
Thanks!
As noted above, I’ve already switched out the wheel for a new one so I’ll never know for sure.
But, I can try all six iterations of RGB channel combinations tonight and see if any one of the combos generates a positive slope for both graphs, which will help me narrow down how badly I messed up the filter order (if at all).
😂
Thanks again to all providing feedback.
|
You cannot like this item. Reason: "ANONYMOUS".
You cannot remove your like from this item.
Editing a post is only allowed within 24 hours after creating it.
You cannot Like this post because the topic is closed.
Copy the URL below to share a direct link to this post.
This post cannot be edited using the classic forums editor.
To edit this post, please enable the "New forums experience" in your settings.
Hi,
as far as I know when you use SPCC with an OSC camera (I have one) the sensor curve has to be set to ideal BECAUSE the sensor response and bayer matrix response is all in one in the R G B response curves.
Having used SPCC since I started Astrophoto, I never had such a SPCC deviant curve and IMHO you shoud solve this strange behaviour before processing further. The only discussion I had on the PI forum were on "DBE before or after SPCC". Most of the time the experts agree that SPCC should be done first before anything else in linear state. If you really have some distorted stars you might run BXT in correct mode only before just to secure that your stars are sufficiently defined to be viewed as stars by SPCC. No DBE, no ABE, no GC, before and chose the most representative background with no stars even if it is small.
Hope this helps, Frédéric
|
You cannot like this item. Reason: "ANONYMOUS".
You cannot remove your like from this item.
Editing a post is only allowed within 24 hours after creating it.
You cannot Like this post because the topic is closed.
Copy the URL below to share a direct link to this post.
This post cannot be edited using the classic forums editor.
To edit this post, please enable the "New forums experience" in your settings.
Frédéric Ruciak:
Hi,
as far as I know when you use SPCC with an OSC camera (I have one) the sensor curve has to be set to ideal BECAUSE the sensor response and bayer matrix response is all in one in the R G B response curves.
Having used SPCC since I started Astrophoto, I never had such a SPCC deviant curve and IMHO you shoud solve this strange behaviour before processing further. The only discussion I had on the PI forum were on "DBE before or after SPCC". Most of the time the experts agree that SPCC should be done first before anything else in linear state. If you really have some distorted stars you might run BXT in correct mode only before just to secure that your stars are sufficiently defined to be viewed as stars by SPCC. No DBE, no ABE, no GC, before and chose the most representative background with no stars even if it is small.
Hope this helps, Frédéric Interesting, I have tried all sort of combinations: DBE-SPCC, DBE-usual CC, GraXpert-SPCC, SPCC-GraXpert, etc. Made distinctive effects for different targets. Most consistent is GraXpert-DBE-SPCC. CS!
|
You cannot like this item. Reason: "ANONYMOUS".
You cannot remove your like from this item.
Editing a post is only allowed within 24 hours after creating it.
You cannot Like this post because the topic is closed.
Copy the URL below to share a direct link to this post.
This post cannot be edited using the classic forums editor.
To edit this post, please enable the "New forums experience" in your settings.
I bet if you try all six combinations, you will find one that is “correct”.
As to how you got it wrong… Don’t worry about it. Just confirm that the new filter wheel is correct. Keep in mind that with interference filters you need to actually look THROUGH them to identify the color. You can’t look at the color of the reflection from staring at the filter.
|
You cannot like this item. Reason: "ANONYMOUS".
You cannot remove your like from this item.
Editing a post is only allowed within 24 hours after creating it.
You cannot Like this post because the topic is closed.
Copy the URL below to share a direct link to this post.
This post cannot be edited using the classic forums editor.
To edit this post, please enable the "New forums experience" in your settings.
Exactly. One of six will be right. But, this is not a point that I have been making. This “correct “ one will vary from case-to-case. Basically, “correct “ in one case doesn’t mean will be correct for another.
CS!
Armen
|
You cannot like this item. Reason: "ANONYMOUS".
You cannot remove your like from this item.
Editing a post is only allowed within 24 hours after creating it.
You cannot Like this post because the topic is closed.
Copy the URL below to share a direct link to this post.
This post cannot be edited using the classic forums editor.
To edit this post, please enable the "New forums experience" in your settings.
You guys are absolutely amazing. After channel combining all 6 iterations of RBG, GBR, RGB, etc, I indeed found the right combo. You were all 100% correct —— I mixed up my filters like an idiot in my filter wheel. After doing some really light processing, the results were entirely encouraging. I can’t tell you how much I appreciate the feedback and quick troubleshoot. You saved me hours of going down the wrong road in post-processing. Apparently, I accidentally switched my filters as follows: Red - was improperly labeled blue Green - was improperly labeled red Blue - was improperly labeled green. What a mess! But now fully saved. THANK YOU THANK YOU THANK YOU!  |
You cannot like this item. Reason: "ANONYMOUS".
You cannot remove your like from this item.
Editing a post is only allowed within 24 hours after creating it.
You cannot Like this post because the topic is closed.
Copy the URL below to share a direct link to this post.
This post cannot be edited using the classic forums editor.
To edit this post, please enable the "New forums experience" in your settings.